A Journey of Performance Tuning KafkaStream Application
A jounery of performance tuning KafkaStream application
In this post, we’ll discuss our journey of tuning the performance of a few Kafka and KafkaStream application.
Principals
Divide and conquer Breaking down overall performance target into individual components have been proved works very efficient. In a distributed system that has a dozen services, There could be many bottlenecks, which might interfere with each other; It is extremely challenging to test the hypothesis in such a dynamic environment.
By define performance target for individual components and strategically tackling “low hanging fruit”, We were able to archive significant improvement in a short period.
Measurement
It is essential to measure the system before even tuning it. Having measurement in place helps the team understand the current and historical performance of the system.
Usually, the performance tuning requirements are described in one of the following formats:
-
The 99th percentile of API response time must not be larger than
xmilliseconds(latency). -
The system should completely process
messages inn` seconds (throughput).
By creating customised metrics that measure latency and throughput, and create a dashboard from collected metric data, We’re able to test the hypothesis at a swift pace.
Observibility
With the measurement capability built-in, we do observe significant latency during performance testing. However, without comprehensive insights into the system, it is challenging to locate the bottlenecks.
There’re two types of metrics that are essential to have to build meaningful insights into an application:
-
infrastructure metrics e.g. CPU utilisation, Memory utilisation, Network IO, Disk IO
-
application metrics e.g. JVM metrics, Kafka producer, consumer, Kafka stream metrics etc.
Collecting these metrics and create a comprehensive dashboard for an application give us a single place to identify the potential bottleneck.
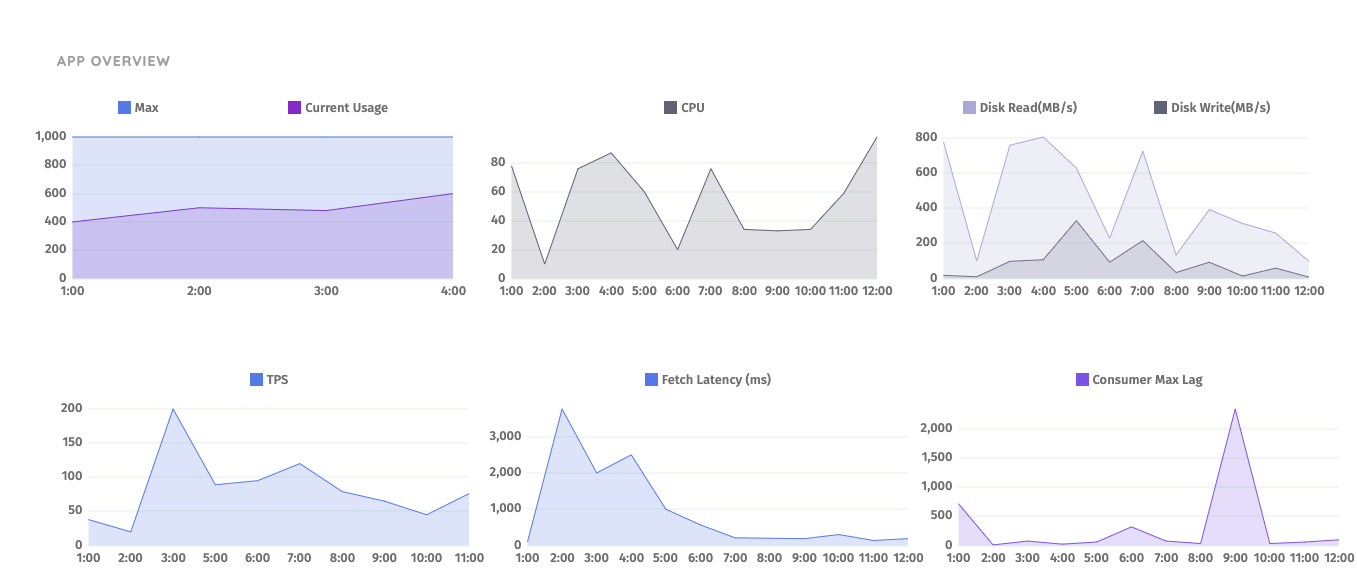
There’re many options for metric collection and aggregation. We use AppDynamic to collect and visualise these metrics, it has been beneficial to be able to have the ability to look at these metrics retrospectively after we changed a few parameters.
Also, Kafka exports a load of metrics via JMX, people might be overwhelmed when looking to them. We found this blog post from datadog is the best of explaining the meaning and indication of some key metrics.
KafkaStream App Tuning
Offheap memory usage
Compared to an application that only uses plain old Kafka producer and consumer, KafkaStream application requires more resources.
We noticed that our KafkaStream application’s memory usage constantly growing and eventually used up all available memory.
It turns out that this is not a memory leak. Rocks DB used a large portion of off-heap memory (non-heap memory), even JVM heap memory usage is stabilised around 400MB, the RSS (Resident set size) of this application process continually growing.
KafkaStream creates local state store which is optionally backed up to changelog topic for stateful operation (e.g. join, groupBy, etc.).
The following formula illustrates memory requirements for a stream application with default rocks DB settings.
one_rocks_db_memory_footprint = write_buffer_size_mb  * write_buffer_count + block_cache_size_mb

# default one_rocks_db_memory_footprint is 16MB * 3 + 50MB = 98MB

over_all_footprint_of_one_windowed_state_store  =  partition_number * segment_count * one_rocks_db_memory_footprint

# default over_all_footprint_of_one_windowed_state_store is 12 * 3 * 98MB = 3528MB
There’re eight windowed joins in our application, the off-heap memory is 8 * 3528MB = 28224MB.
By providing a customised rocksdb configure, we can limit the off-heap memory to less than 4GB, provided that we haven’t observed performance degradation.
Minimise overall latency
There’re multiple consumer and producers in a KafkaStream application. Any misconfigured consumer/producer properties could contribute to the overall delay.
-
Consumer
commit.interval.msThis value allows us to make a trade-off between throughput and latency. A larger value increases system throughput but adds “artificial delays”. A smaller value will lead to more frequent consumer offset commits.
-
Producer
batch.sizeandlinger.msThe default value ofbatch.sizeis 16KB, and average record size is 6KB, which means the producer need perform asendoperation for every 2~3 messages, plus there is inevitable network latency between our application and Kafka Broker. By increasingbatch.sizeto 1MB and setlinger.msto 50, we reduced the network latency overhead per message, and observed improvements on throughput and latency.
Stateful Operation and Change log restore process
One of my favourite feature of KafkaStream is the stateful operation without losing the ability of horizontal scaling.
However, we could be caught by some unexpected behaviours without using this operation cautiously.
Kafka Stream creates a local state store for each partition to perform the stateful operation, with the option of back up data to changelog topic.
If retention.ms is not specified, broker config log.retention.ms(default 7 days) will be used as a retention period of changelog topic.
Choosing the right window size, changelog topic retention period is essential for avoiding a lengthy change log restore process.